Predictions Are Out: These 3 Altcoins on Binance Could Crash Badly!
According to crypto analyst Filip L, dark clouds are hovering over Polkadot (DOT). The analyst also says that Tezos (XTZ) price is nearing the end of the game in the bearish triangle. According to another analyst, Akash Girimath, a 65% collapse of Litecoin (LTC) is possible if the bearish fate unfolds. We have compiled analysts' analysis of these three altcoin projects for our readers.
"Kata clouds hovering over altcoins"
Polkadot sees dark clouds forming over price action as geopolitical forces and central banks once again squeeze the market. Putin sees the West as a threat to Russia and has called for mobilization to send around 300,000 troops to Ukraine. He also put the use of nuclear weapons on the battlefield back on the table. Cryptocurrencies are generally on the back foot this morning. Add to that the Fed rate hike meeting, which you will follow on cryptoify.blogspot.com. For now, there is no silver lining in sight.
Lower highs in the DOT price are a perfect reflection of this sentiment with bulls with their faces in the mud as the bears overwhelm them. A break below $6.23 is possible in the near term. In case of a tight close below, further downside risk is likely. If the current elements continue to develop in a negative direction, $1.42 by the end of the year is possible.
 |
| DOT daily chart |
Several tail risks are keeping the price action muted. However, the Relative Strength Index showed a small shakeout reaction today. So, there seems to be a small buy at $6.23. If the Fed comes out less hawkish than usual this evening, we expect to see a possible upside. Such an outcome would probably mean that DOT will go to $7.00.
"XTZ sails to $1.19"
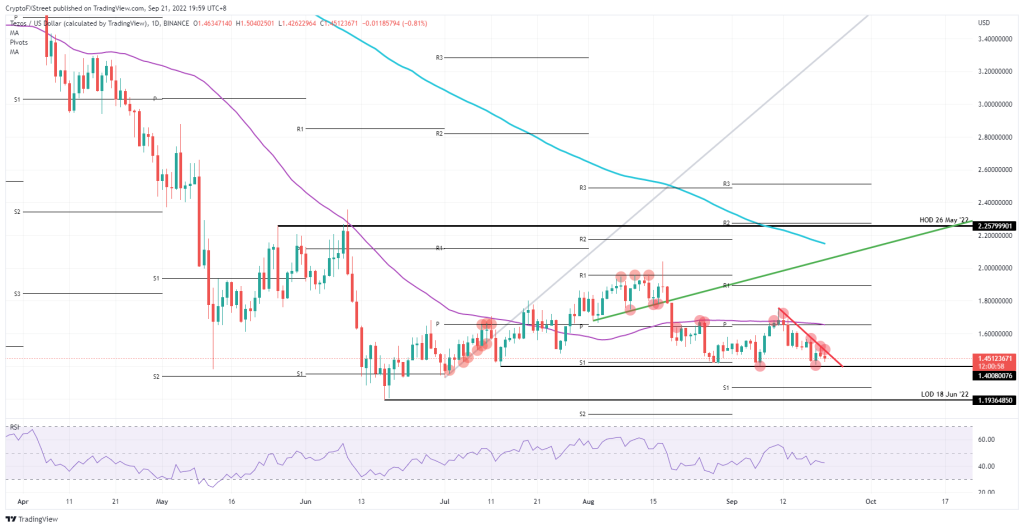
Tezos tried to test the descending trend line of the bearish triangle for the fourth time today. However, it failed to break above it once again. Price action is going nowhere at the moment. While this morning's rhetoric is quite harsh, it proves that bulls are somewhat reluctant to give up their positions. After the Fed makes its announcement this evening, we expect a quick downward move in Tezos towards $1.40.
A catalyst for the altcoin will likely be tonight's Fed decision. Otherwise, it will continue to move in a bearish triangle until it can pull the price action to the floor. $1.40 looks ready to be broken. Then there is not much room between the 2022 low of $1.40 and $1.19. Therefore, it is at risk. In case the bulls sell out completely, a new low print for 2022 is possible. The Relative Strength Index (RSI) is still quite high. So there is still enough room until it reaches the oversold area.
 |
| XTZ daily chart |
There are also too many bullish signals to be filtered through current events in the markets or from a technical perspective. Nevertheless, one element stands out that should be taken as a bullish sign. The price action since Monday has been trading on a much smaller scale. With the highs and lows since Monday, it is possible that a breakout could occur with a bullish penetration towards $1.60.
"Litecoin price shows its hand"
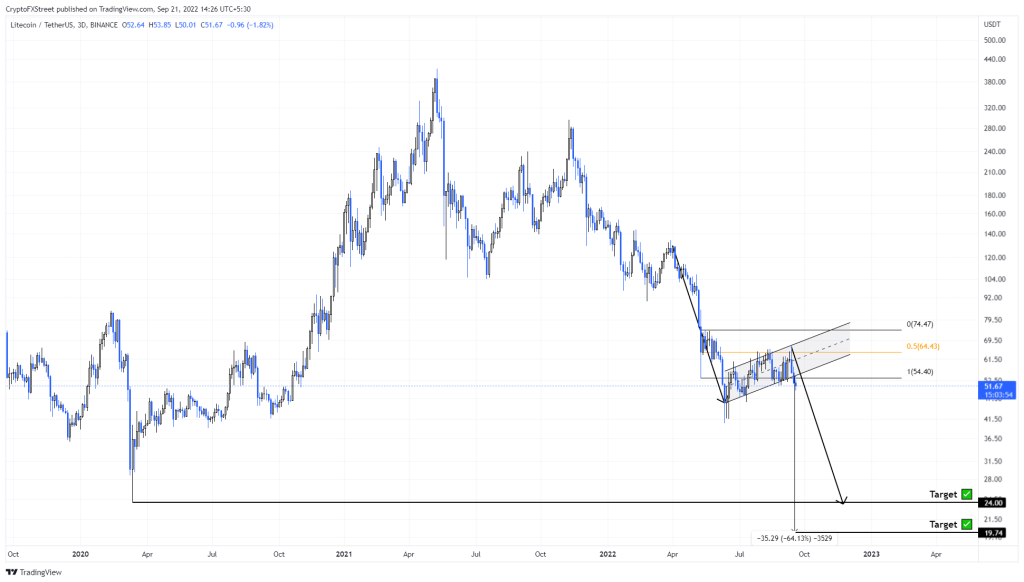
Litecoin fell roughly 64% between April 1 and June 12. That took it from $128 to $51. This steep correction was followed by a recovery phase that boosted LTC by 62% over the next three months. Thus, between April and September, Litecoin price action led to the formation of a bear flag, a bearish continuation pattern on the charts that points to more losses ahead. As the name suggests, the pattern resembles a flag on a pole, only in the case of the 'upside down' bearish version.
In this case, the 64% correction became the flagpole, while the 62% recovery rally in the form of higher highs and higher lows formed the flag. The setup suggests a continuation of the bear trend for Litecoin price. We get the target for this technical pattern by measuring the height of the flagpole and extrapolating from the bottom of the flag. Starting from a breakout point at $55, it reveals that LTC will probably fall to $19.74. However, a conservative target would be $24.
 |
| LTC 3-day chart |
Market conditions suggest that traders should pay attention to liquidity at $41.68 and below. If the Litecoin price drops below this level and rebounds quickly, traders should consider an early end to the downside move.
On the other hand, if Litecoin price produces a daily candlestick above $64.43, the midpoint of the $54.40 to $74.47 range, this will signal a weak sell-side camp. Moreover, this move will allow the bulls to take control. Therefore, it would invalidate the bearish thesis for LTC. In such a case, market participants can expect the altcoin price to try to retest the high range at $74.47.
Source: Fxstreet
Follow us on Twitter, Facebook, and Instagram to be instantly informed about the latest news.


Post a Comment